SPX GEX | S&P 500 Real-Time Gamma Exposure & Intraday Levels
Monitor real-time SPX GEX, 0DTE dollar net gamma exposure, S&P 500 Call Walls, Put Walls, and Zero Gamma Flip thresholds. Quantify how market maker delta hedging obligations dictate intraday S&P 500 index volatility and price discovery.
S&P 500 Index · Net GEX & Volatility Boundaries
Underlying SPX
Per 1% Move
Primary Overhead Resistance
Primary Downside Support
Regime Transition Threshold
| Metric Level | SPX Strike | Distance from Spot | Market Maker Role | Volatility Impact |
|---|---|---|---|---|
| SPX Call Wall | $8000.00 | +265.09 pts (+3.43%) | Heavy Call Open Interest Pin / Major Resistance | Dealers Short Calls / Damping Upward Surges |
| SPX Spot Price | $7734.91 | 0.00 pts (Current) | Underlying S&P 500 Index Cash Value | Mean-Reverting Intraday Flow |
| SPX Zero Gamma Flip | $7682.63 | -52.28 pts (-0.68%) | Long to Short Gamma Transition Threshold | Volatility Shift Zone (Long GEX → Short GEX) |
| SPX Put Wall | $8000.00 | +265.09 pts (+3.43%) | Heavy Put Open Interest Floor / Primary Support | Dealers Long Puts / Buying Index Futures on Dips |
| 0DTE Intraday Gamma | PRO EXCLUSIVE | Sub-second live streaming | Real-time 0DTE Call/Put Wall migrations & intraday gamma flip alerts | Unlock in Pro ($99/mo) |
SPX Pre-Market Institutional Outlook & Plain-English Interpretation
With SPX spot trading at $7734.91 (above the Zero Gamma Flip of $7682.63), options market makers operate in a Positive Gamma Regime. In this state, dealers are mathematically required to trade counter-trend: buying underlying futures on dips and selling into rallies. This systematic hedging suppresses realized volatility, pinning price action between structural boundaries.
Primary overhead resistance is anchored at the SPX Call Wall ($8000.00), representing a distance of +265.09 pts (+3.43%). Primary institutional downside support rests at the SPX Put Wall ($8000.00), located +265.09 pts (+3.43%) below current price.
Mean-reversion fades at Put Wall touches offer favorable 3:1+ risk-to-reward setups, while rallies into the Call Wall face persistent dealer selling pressure.
Understanding Real-Time SPX Gamma Exposure (SPX GEX)
What is SPX Gamma Exposure (SPX GEX)?
SPX Gamma Exposure (SPX GEX) measures how S&P 500 market maker option positions force real-time delta hedging. Positive SPX GEX suppresses market volatility by compelling dealers to buy dips and sell rallies, while negative GEX accelerates downside selling pressure.
In financial options markets, SPX gamma exposure represents the mathematical rate of change in options market maker deltas relative to underlying price shifts in the S&P 500 index. Because options dealers maintain delta-neutral books, any movement in the S&P 500 forces market makers to dynamically buy or sell index futures (such as E-mini ES contracts) to stay fully hedged.
When institutional traders purchase call options, market makers take the opposing side by shorting calls and buying underlying index futures to hedge delta. As the S&P 500 rises, the call delta increases, forcing dealers to buy additional futures to remain neutral. This programmatic feedback loop is at the heart of modern market microstructure and makes the GEX Horizon Real-Time Gamma Dashboard an indispensable tool for active equity traders.
Live SPX Net GEX Current Value & 0DTE Breakdown
Explore real-time net dollar gamma levels across all expirations, zero-day contracts, and monthly settlement cycles using our interactive Gamma Heatmaps and Gamma Histograms.
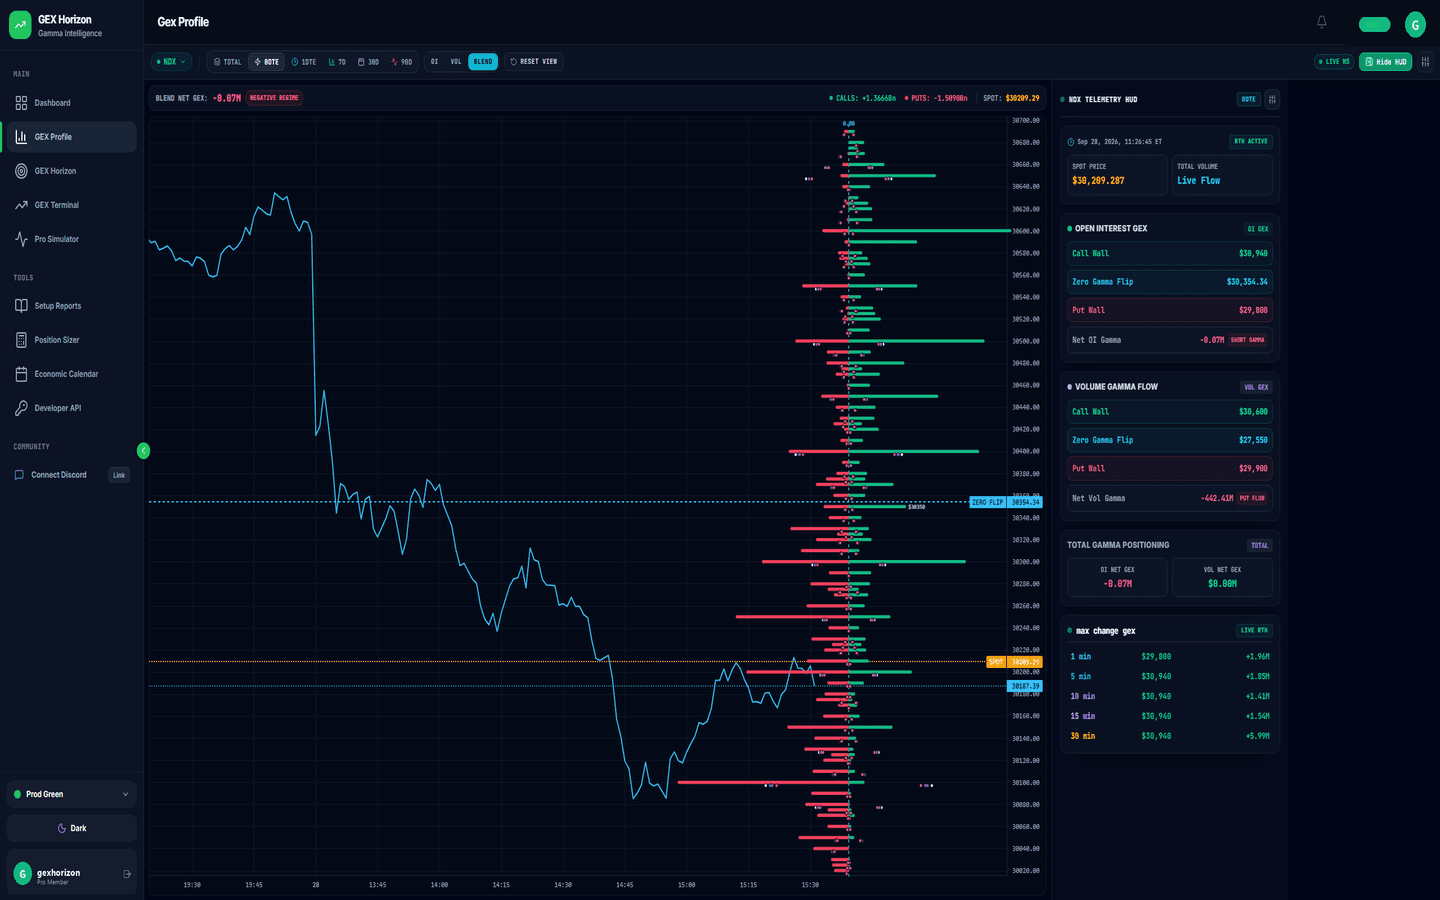
0DTE SPX Net GEX Current Value vs All Expirations
Zero Days to Expiration (0DTE) S&P 500 option contracts now generate over 40% of daily total CBOE index volume. Because 0DTE options possess extreme gamma decay (gamma speed), intraday retail and institutional order flow can alter the spx 0dte net gex current value in minutes. Tracking 0DTE isolated GEX alongside all-expiration GEX reveals whether short-term pin risk aligns with macro structural support.
CBOE Cash-Settled Index Options vs SPY Options
Chicago Board Options Exchange (CBOE) SPX options are European-style, cash-settled contracts based directly on the S&P 500 index without early exercise risk, benefiting from US IRC Section 1256 60/40 tax treatment. In contrast, SPY options are American-style ETF derivative contracts with physical share delivery. While SPX dealers hedge directly via E-mini ES futures, SPY market makers hedge via share baskets and ETF creation units.
S&P 500 Call Wall, Put Wall & Zero Gamma Flip Matrix
Market structure in index options revolves around key gamma concentration nodes. The spx call wall and spx put wall define the upper resistance ceiling and lower support floor, while the spx zero gamma flip acts as the regime shift threshold separating calm market behavior from volatile sell-offs.
Identifying Volatility Suppression vs Volatility Expansion Regimes
When the S&P 500 trades above the zero gamma flip line, dealers operate in a long gamma regime. In this environment, dealer rebalancing forces mean reversion: selling into rallies and buying into dips, creating low VIX volatility suppression. Conversely, when spot drops below the flip line, dealers enter short gamma territory, accelerating downward momentum by selling into falling markets.
Access Zero Gamma Flip & Volatility Regime TrackerHow Dealers Rebalance Delta at the SPX Call Wall and Put Wall
At the Call Wall (e.g., 5,500), large call open interest means dealers are heavily short calls. As spot approaches 5,500, dealer delta buying approaches 100%, but beyond the strike, gamma decay reduces the required hedge, causing dealers to aggressively sell futures to lock in delta neutrality. At the Put Wall (e.g., 5,450), market maker long puts compel heavy buying on dips, creating a formidable market floor.
Review Institutional Options GEX Level MatrixInstitutional SPX Intraday Trading Playbook: Executing GEX Setups
Professional derivatives desks do not treat gamma exposure as a simple indicator. They use strike-level dealer obligations to anticipate liquidity surges, pinpoint structural inflection points, and size intraday momentum. Here are three primary execution setups used by quantitative desks.
Call Wall & Put Wall Boundary Fades
When the S&P 500 operates in a confirmed positive gamma regime (trading above the Zero Gamma Flip), dealer positioning acts as a natural shock absorber. As spot price approaches the Call Wall, market makers are forced to sell index futures to keep deltas neutralized, damping upward momentum.
Zero Gamma Flip Regime Transition
Crossing the Zero Gamma Flip alters market microstructure instantly. Above the flip, dealers supply liquidity by fading price moves. Below the flip, dealers consume liquidity by selling into market drops and buying into rallies, triggering rapid volatility expansion.
0DTE Afternoon Strike Pinning
During the final two hours of the trading session, 0DTE option contracts experience exponential time decay. Market makers holding massive open interest across near-the-money strikes must continuously fine-tune hedges, creating an intense magnetic pull toward peak open interest nodes.
Higher-Order Derivatives Dynamics: How Vanna and Charm Alter Dealer Hedging
Standard gamma exposure measures dealer hedging shifts caused purely by underlying spot price movements. In real-time market microstructure, however, options dealers must constantly rebalance deltas in response to changes in implied volatility (Vanna) and the passage of time (Charm).
The Implied Volatility Feedback Loop
Vanna measures the rate at which an option delta changes relative to shifts in implied volatility. Because institutional investors systematically purchase out-of-the-money puts for portfolio protection, options dealers are predominantly short out-of-the-money put volatility.
When market volatility drops during a steady intraday advance, the delta of those dealer puts collapses. To maintain neutrality, market makers are forced to buy underlying S&P 500 index futures. This mechanical dynamic creates a persistent structural bid, often driving continuous melt-up price action even when discretionary buying volume appears subdued.
The Intraday Time Decay Unwind
Charm measures the rate at which an option delta changes with the passage of time. With the dominance of daily 0DTE options expirations, time decay accelerates dramatically throughout the trading day.
As expiration approaches, the delta of out-of-the-money options steadily decays toward zero. Dealers holding delta hedges against these contracts must systematically unwind their positions. On days with heavy out-of-the-money put open interest, Charm decay generates predictable afternoon buying pressure, while heavy call open interest prompts steady afternoon supply.
Hedging Velocity Index & Delta Hedging Mechanics in SPX Options
Quantifying spx net gamma exposure current values requires continuous aggregation of Black-Scholes gamma metrics across thousands of option strikes.
By aggregating strike-level gamma, total open interest (verified daily via the Options Clearing Corporation (OCC)), and scaling by index spot value, GEX Horizon calculates the dollar delta market makers must rebalance for every 1% move in the index.
Institutional traders utilize this mathematical metric to anticipate liquidity buffers and market maker order flow toxicity under U.S. Securities and Exchange Commission (SEC) market structure guidelines. For an in-depth mathematical walkthrough, consult our full guide on How to Calculate and Interpret SPX Gamma Exposure.
Frequently Asked Questions: SPX GEX & Intraday Levels
Essential answers regarding S&P 500 index options gamma exposure, market maker delta hedging, and intraday level interpretation.