GEX Charts: Visualizing
Market Maker Gamma Exposure & Hedging
Options market makers hold non-directional inventory that requires constant delta rebalancing. Gamma Exposure (GEX) charts translate complex options clearinghouse open interest into visual market maps, revealing where institutional hedging creates volatility resistance, support floors, and trend acceleration zones.
S&P 500 Index (SPX) · Daily Benchmark
The GEX Profile: Visualizing Strike-Level Gamma & Boundary Walls
The GEX Profile chart provides a clear strike ladder of market maker gamma exposure. Individual strikes are mapped with positive call gamma bars (green) and negative put gamma bars (red), instantly highlighting where institutional order flow will enter the market.
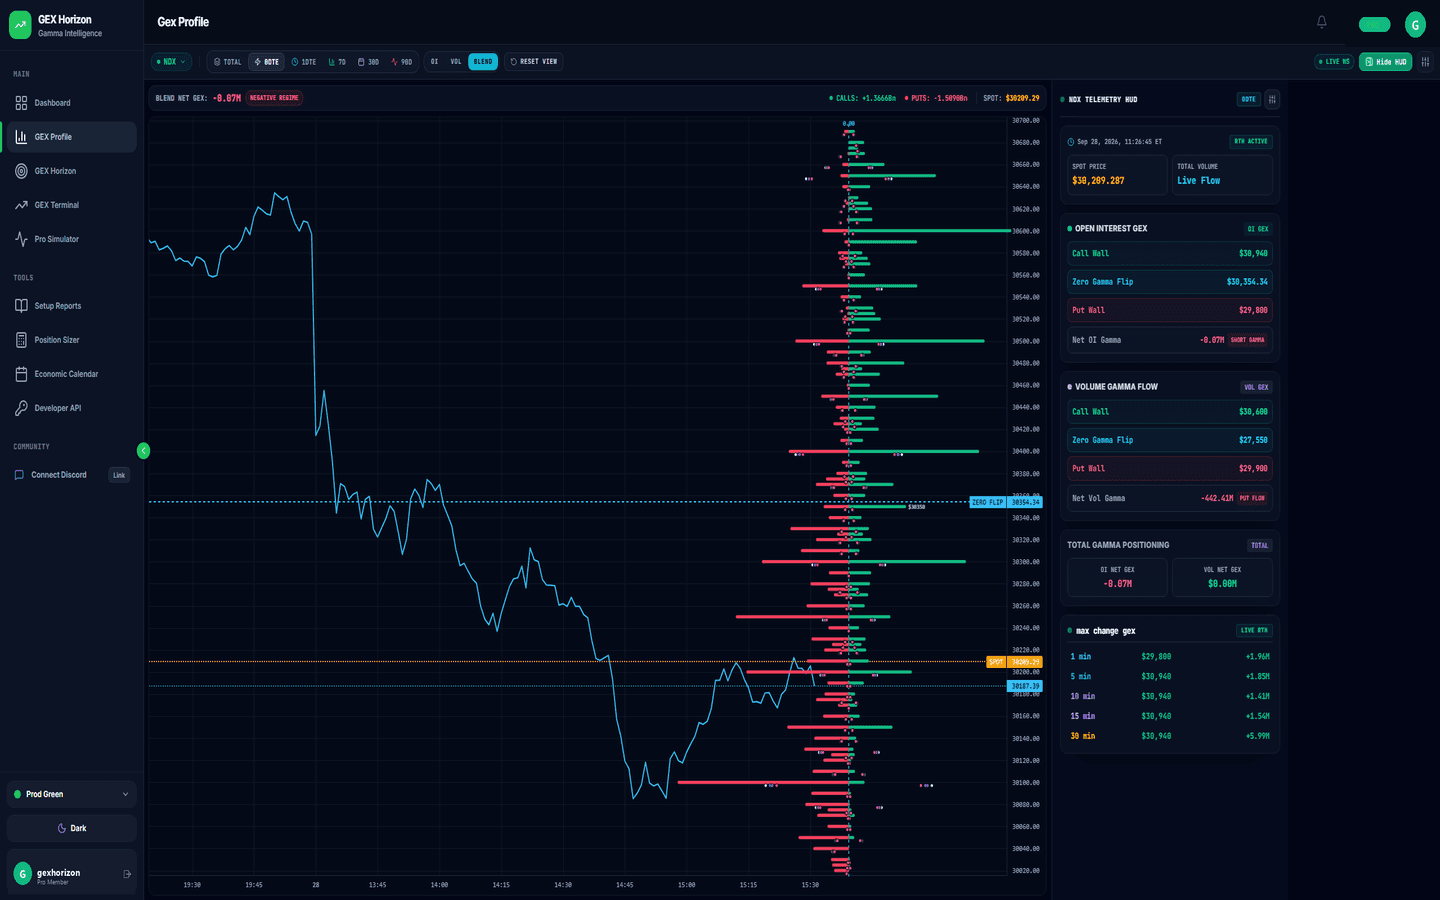
The strike with peak positive gamma. When price rallies toward the Call Wall, market makers sell underlying futures to hedge their long calls, imposing natural upward resistance.
The strike with peak negative gamma. When price tests the Put Wall, market makers absorb selling pressure to hedge their put inventory, creating a reliable support bounce zone.
The inflection point separating calm mean-reversion (above the line) from rapid volatility expansion and breakout cascades (below the line).
GEX Profile Workstation
GEX LiteFull strike ladder histograms, Call/Put Walls, Zero Gamma Flips, and 49 institutional symbols.
The Real-Time GEX Terminal: Intraday Order Flow & Advanced Levels
Professional traders use the live GEX Terminal to inspect multi-timeframe candle action overlaid with real-time gamma levels, monitoring 0DTE velocity order flow, wall migrations, and institutional liquidity in real time.
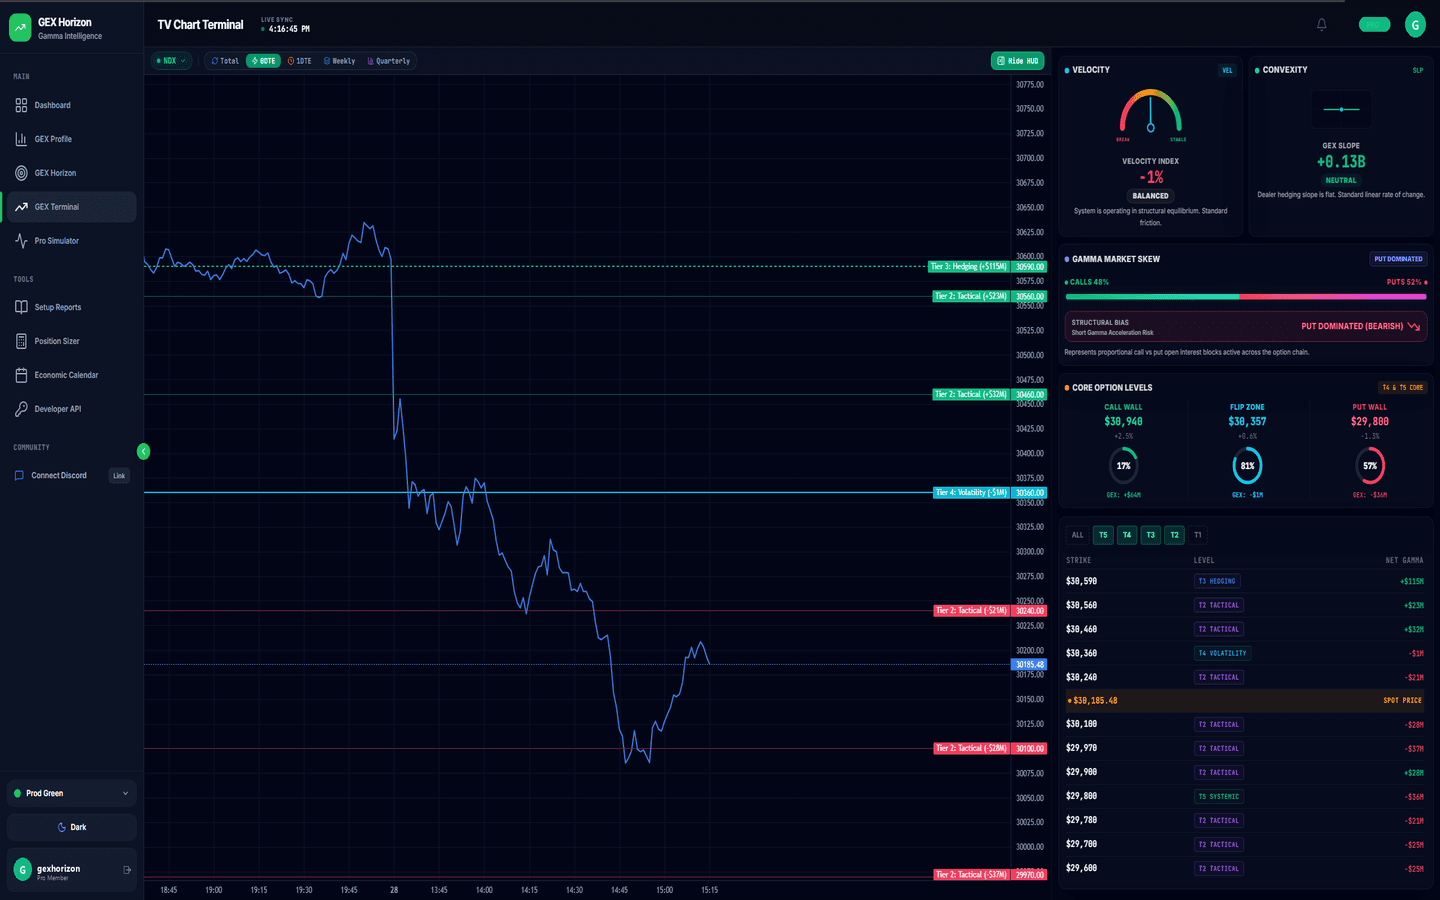
Integrated Microstructure Levels & Advanced Quantitative Metrics
Primary overhead resistance barrier where dealer short call hedging creates heavy selling into rallies.
Major structural support floor where dealer short put delta rebalancing absorbs downside sell pressure.
Dynamic regime inflection line separating calm volatility suppression from high-speed momentum expansion.
Measures 0DTE intraday gamma acceleration and dealer hedging speed, signaling accelerating vs decelerating flow.
Real-time gauge of liquidity cascade vulnerability, warning traders when order books are susceptible to air pockets.
Quantifies gamma curvature and slope speed across nearby strikes, distinguishing stabilizing forces from accelerating risks.
Evaluates call vs put volume and open interest skew to confirm whether market participants are call-dominated or put-dominated.
Pinpoints dominant strike clusters exerting gravitational attraction on index cash settlement during final market hours.
Options strike levels dynamically translated to exact TradingView (CFD) and Goat (Futures) price coordinates.
Real-Time Pro Terminal
Pro TraderSub-second WebSocket streaming, 0DTE velocity radar, Shock Index, and TradingView/Goat coordinates.
3 Rules for Reading & Trading GEX Charts
Professional execution does not require complicated calculations. Apply these three structural rules when reading gamma charts:
Identify the Regime
Check whether price is trading above or below the Zero Gamma Flip. Above the flip, trade range-bound mean reversion. Below the flip, trade breakouts and look for expanding momentum.
Target Boundary Walls
Use the Call Wall as your primary upside target and fade zone, and the Put Wall as your primary downside support target. In positive gamma, price rarely sustains a clean breach beyond these levels on the first test.
Watch Late-Day Pins
In the final 90 minutes of trading, 0DTE gamma concentration creates magnetic gravitational pull toward high-volume strike clusters, frequently pinning price directly into the session finish.
Trade with Institutional Microstructure Coordinates
Integrate dynamic Call Walls, Put Walls, and Zero Flips directly into your daily trading workstation.
Explore Gamma Exposure Benchmark Terminals
Access dedicated strike distributions, key gamma levels, and daily benchmark baselines across major index and single-stock derivatives:
Frequently Asked Questions: Reading GEX Charts
Practical answers to key questions regarding gamma exposure charts, strike levels, and dealer hedging behavior.
A GEX chart visualizes market maker hedging commitments across strike prices. Strikes with positive bars show where dealers hold long call gamma, which acts as resistance by dampening volatility. Strikes with negative bars show where dealers hold short put gamma, which accelerates market momentum. The highest positive bar identifies the Call Wall (primary overhead ceiling), while the largest negative bar identifies the Put Wall (primary downside support floor).
Choose Your Plan & Go Straight to Checkout
Unlock institutional dealer rebalancing thresholds, Call/Put Walls, and real-time gamma order flow. Select your preferred workstation tier below:
Strike-Level GEX Profiles
Full strike ladder histograms, Call/Put Walls, Zero Gamma Flips, intraday lookback shifts, and 49 institutional assets.
Full Live Terminal & 0DTE Stream
Zero-latency sub-second WebSocket feed, Velocity Index, Shock Index, Convexity Status, and live multi-asset charting.