How to Read a Gamma Exposure (GEX) Chart: A Step-by-Step Guide
Learn how to read options gamma exposure charts, identify call and put walls, find the zero gamma flip price, and incorporate GEX data into your trading.
How to Read a Gamma Exposure (GEX) Chart: A Step-by-Step Guide
When trading high-volume equity indices or popular stock options, traditional charts showing price bars and volume histograms only display what has already happened. To predict where major institutional players will step in to stabilize or accelerate a move, you need to monitor market maker positioning.
The most powerful tool for this is the gamma exposure chart (often called the gamma exposure gex chart). Below, we break down how to read these charts step-by-step and how to integrate GEX levels into your daily execution setups.
Anatomy of a Gamma Exposure Chart
A standard GEX chart displays the aggregate net dollar-gamma exposure held by market makers across a range of option strike prices.
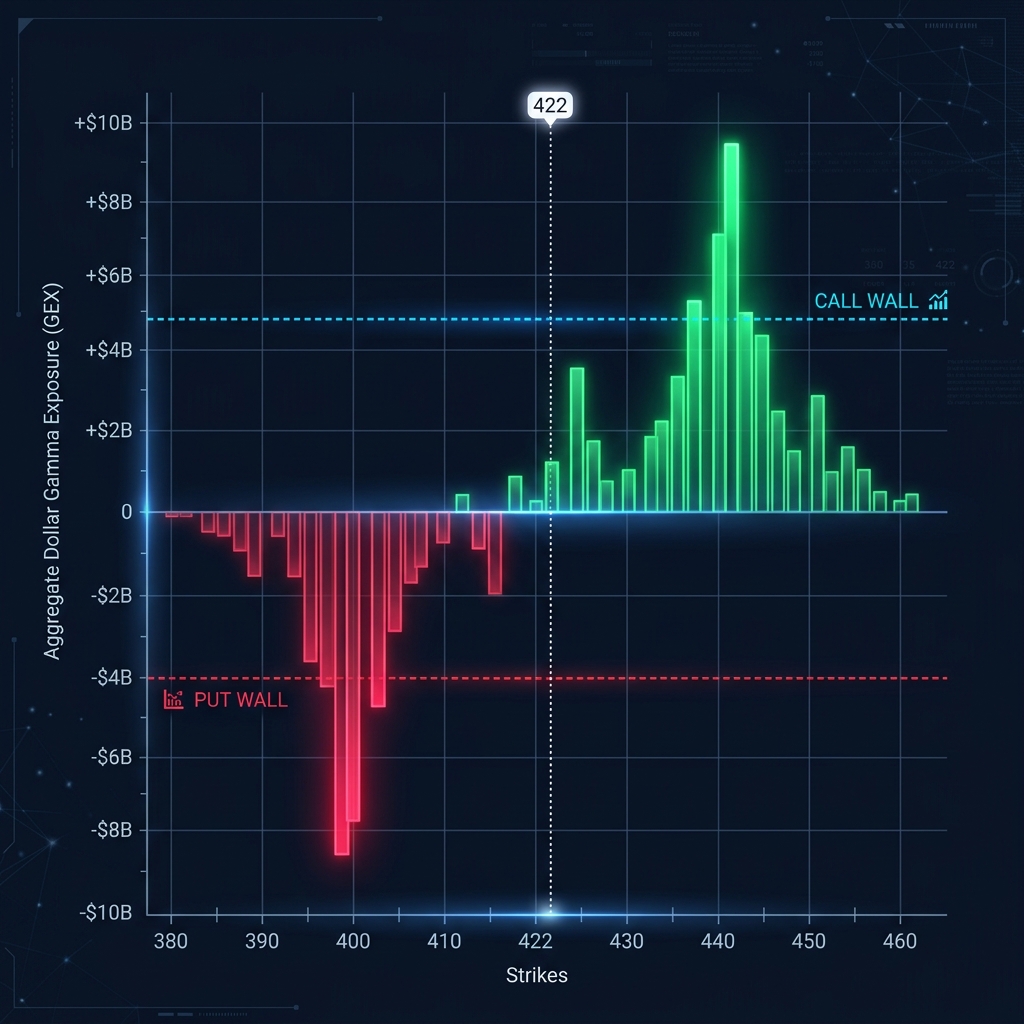
When analyzing gamma exposure charts, you will look at four primary elements:
1. The Horizontal Axis (Option Strikes)
The X-axis displays the strike prices for the S&P 500 (SPX), SPY, or target stock contracts. This helps you map options-chain dynamics directly to actual price coordinates on your execution screens.
2. The Vertical Axis (Net Gamma Exposure)
The Y-axis represents the dollar amount of underlying stock that market makers must buy or sell per 1% move in the stock price.
- Positive Bars (Green): Represent net positive gamma zones where dealer hedging stabilizes the market.
- Negative Bars (Red): Represent net negative gamma zones where dealer hedging accelerates trends.
3. The Call Wall (Highest Positive Peak)
The Call Wall represents the strike price with the largest concentration of net positive gamma. Because retail traders buy calls, dealers are short calls and must buy stock to hedge. Once the index price reaches the Call Wall, profit-taking and option expirations force dealers to dump their stock hedges, creating a natural ceiling for rallies.
4. The Put Wall (Largest Negative Trough)
The Put Wall represents the strike price with the largest concentration of net negative gamma. It behaves as a major floor. If the spot price breaks below the Put Wall, dealers must sell stock or futures aggressively to remain delta-neutral, triggering rapid sell-offs.
Using a GEX Chart: Practical Walkthrough Legend
To convert a free gamma exposure chart or a professional gamma exposure dashboard into an execution setup, use this quick reference guide:
| Chart Level | Indicator Behavior | Tactical Action | | :--- | :--- | :--- | | Spot Price > Zero Flip | Positive Gamma. Mean reversion. Dampened volatility. | Focus on premium-collection strategies (e.g. Iron Condors) or scalp range bounds. | | Spot Price < Zero Flip | Negative Gamma. Trend expansion. High volatility. | Avoid buying dips. Focus on momentum breakouts, buying puts, or shorting index futures. | | Price Approaching Call Wall | Buying pressure slows. Dealers begin unloading long stock hedges. | Take profit on long index calls or look for exhaustion signs to short. | | Price Approaching Put Wall | Support floor. Market makers buy futures to defend positions. | Scalp a bounce with a very tight stop-loss placed just below the Put Wall strike. |
Tracking GEX Mid-Session
Remember that GEX layouts are dynamic. As option contracts approach expiration (especially in 0DTE environments), or as traders adjust their positions, GEX levels shift. Maintaining a live, auto-updating dashboard is essential to tracking how Call/Put Walls migrate during the session.
By aligning your execution levels with the horizontal coordinates on a gamma exposure chart, you trade with the flow of institutional market makers, giving you a definitive edge over purely technical indicators.
Related Research
Crypto Microstructure: Understanding the Ethereum Options Gamma Flip
Crypto Microstructure: Understanding the Ethereum Options Gamma Flip
